In today’s fast-paced and competitive business landscape, it is essential for investors and industry enthusiasts to thoroughly analyze companies before making investment decisions. In this article, we will conduct a comprehensive industry comparison, evaluating Amazon.com (NASDAQ:AMZN) against its key competitors in the Broadline Retail industry. By examining key financial metrics, market position, and growth prospects, we aim to provide valuable insights for investors and shed light on company’s performance within the industry.
Amazon.com Background
Amazon is the leading online retailer and marketplace for third party sellers. Retail related revenue represents approximately 74% of total, followed by Amazon Web Services (17%), and advertising services (9%). International segments constitute 22% of Amazon’s total revenue, led by Germany, the United Kingdom, and Japan.
| Company | P/E | P/B | P/S | ROE | EBITDA (in billions) | Gross Profit (in billions) | Revenue Growth |
|---|---|---|---|---|---|---|---|
| Amazon.com Inc | 34.49 | 7.06 | 3.82 | 6.02% | $45.5 | $91.5 | 13.4% |
| Alibaba Group Holding Ltd | 18.23 | 2.65 | 2.70 | 4.26% | $53.52 | $111.22 | 1.82% |
| PDD Holdings Inc | 14.65 | 3.80 | 3.50 | 8.89% | $25.79 | $58.13 | 7.14% |
| MercadoLibre Inc | 51.35 | 17.15 | 4.07 | 7.06% | $0.88 | $3.21 | 39.48% |
| Sea Ltd | 73.89 | 8.77 | 4.61 | 4.36% | $0.58 | $2.41 | 38.16% |
| Coupang Inc | 137.29 | 11.11 | 1.60 | 2.02% | $0.32 | $2.72 | 17.81% |
| JD.com Inc | 8.71 | 1.39 | 0.27 | 2.68% | $7.34 | $56.64 | 22.4% |
| eBay Inc | 19.47 | 8.41 | 3.88 | 13.35% | $0.74 | $2.0 | 9.47% |
| Vipshop Holdings Ltd | 10.50 | 1.75 | 0.69 | 3.74% | $1.91 | $6.05 | -3.98% |
| Dillard’s Inc | 16.73 | 4.93 | 1.46 | 3.86% | $0.14 | $0.58 | 1.41% |
| Ollie’s Bargain Outlet Holdings Inc | 37.31 | 4.42 | 3.26 | 3.49% | $0.09 | $0.27 | 17.49% |
| MINISO Group Holding Ltd | 20.60 | 4.37 | 2.59 | 4.56% | $0.73 | $2.2 | 23.07% |
| Macy’s Inc | 11.69 | 1.24 | 0.25 | 1.95% | $0.36 | $2.1 | -1.9% |
| Kohl’s Corp | 9.71 | 0.52 | 0.13 | 3.97% | $0.45 | $1.53 | -4.98% |
| Hour Loop Inc | 78.67 | 11.59 | 0.60 | 18.14% | $0.0 | $0.02 | -3.45% |
| Average | 36.34 | 5.86 | 2.11 | 5.88% | $6.63 | $17.79 | 11.71% |
table {
width: 100%;
border-collapse: collapse;
font-family: Arial, sans-serif;
font-size: 14px;
}
th, td {
padding: 8px;
text-align: left;
}

Considering trying out virtual dating RN? We got you. Here are some tips to turn you into a video dating pro — instantly.
th {
background-color: #293a5a;
color: #fff;
text-align: left;
}
tr:nth-child(even) {
background-color: #f2f4f8;
}
tr:hover {
background-color: #e1e4ea;
}
td:nth-child(3), td:nth-child(5) {
text-align: left;
}
Are You Taking One of These 9 “Memory Erasing” Prescriptions? [ad]
You may think your memory loss is just a sign of getting older, but one of these 9 drugs could actually be damaging your brain... These 9 prescription drugs have now been linked to Alzheimer's disease diagnoses. If you're over the age of 60, and you're taking even 1 of these 9 drugs, your brain could be at risk. Click here to learn more.
.dividend-amount {
font-weight: bold;
color: #0d6efd;
}
.dividend-frequency {
font-size: 12px;
color: #6c757d;
}
When closely examining Amazon.com, the following trends emerge:
-
The stock’s Price to Earnings ratio of 34.49 is lower than the industry average by 0.95x, suggesting potential value in the eyes of market participants.
-
With a Price to Book ratio of 7.06, which is 1.2x the industry average, Amazon.com might be considered overvalued in terms of its book value, as it is trading at a higher multiple compared to its industry peers.
-
With a relatively high Price to Sales ratio of 3.82, which is 1.81x the industry average, the stock might be considered overvalued based on sales performance.
-
The Return on Equity (ROE) of 6.02% is 0.14% above the industry average, highlighting efficient use of equity to generate profits.
-
The Earnings Before Interest, Taxes, Depreciation, and Amortization (EBITDA) of $45.5 Billion is 6.86x above the industry average, highlighting stronger profitability and robust cash flow generation.
-
The gross profit of $91.5 Billion is 5.14x above that of its industry, highlighting stronger profitability and higher earnings from its core operations.
-
With a revenue growth of 13.4%, which surpasses the industry average of 11.71%, the company is demonstrating robust sales expansion and gaining market share.
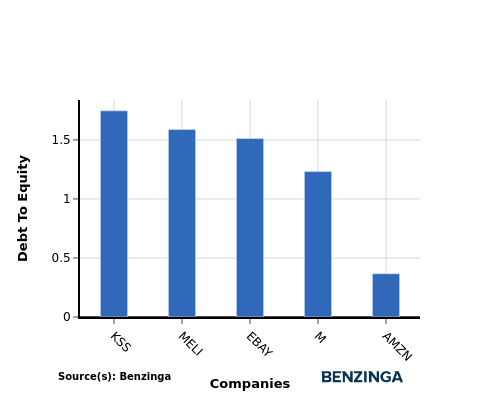
Debt To Equity Ratio

If you can’t decide whether to get the 2-in-1 Windows tablet hybrid, traditional laptop, or desktop, we’re here to help.
The debt-to-equity (D/E) ratio is a measure that indicates the level of debt a company has taken on relative to the value of its assets net of liabilities.
Considering the debt-to-equity ratio in industry comparisons allows for a concise evaluation of a company’s financial health and risk profile, aiding in informed decision-making.
In light of the Debt-to-Equity ratio, a comparison between Amazon.com and its top 4 peers reveals the following information:
-
Amazon.com demonstrates a stronger financial position compared to its top 4 peers in the sector.
-
With a lower debt-to-equity ratio of 0.37, the company relies less on debt financing and maintains a healthier balance between debt and equity, which can be viewed positively by investors.
Key Takeaways
For Amazon.com, the PE ratio is low compared to its peers in the Broadline Retail industry, indicating potential undervaluation. The PB and PS ratios are high, suggesting a premium valuation based on book value and sales. In terms of profitability metrics, Amazon.com shows high ROE, EBITDA, and gross profit margins, reflecting strong operational efficiency and financial performance. Additionally, the high revenue growth rate further highlights Amazon.com’s competitive position within the industry.
This article was generated by Benzinga’s automated content engine and reviewed by an editor.